

Building Trust in AI
Project
Sterling Fulfillment Optimizer, Optimization Dashboard
Role
UX & Visual Designer
Responsibilities
Participation in all research and workshop activities, design, delivery, and documentation
Team
2 UX designers (our lead and myself), 1 content designer, 1 design researcher
Sterling Fulfillment Optimizer (SFO) is an AI solution that optimizes order management systems by finding the best possible store, warehouse, or vendor for online order fulfillment. It balances predefined business rules with real cost drivers to make the best fulfillment decisions for business outcomes.
Challenge
Lack of visibility into why Optimizer made the decisions it made, combined with inconsistencies in data left our customers feeling like they couldn’t fully trust SFO and its fulfillment decisions.
Goal
Eliminate the black box, give our customers the confidence that they can trust our offering to make fulfillment decisions that will yield for them the best business results.
Visioning workshop process
Using Enterprise Design Thinking methods, all cross-functional teams collaborated to identify opportunities and solutions for our fulfillment manager persona. These teams included product management, front and back end development, content design, user experience design, and design research. We completed a few main activities that gave us the foundation needed to design the best possible experience for our customers.
*Please note: Some images have been redacted or modified for confidentiality reasons.
-
1. Identify user needs
Using the EDT needs statement exercise, we determined what our fulfillment manager persona needs in order to achieve his business goals.
-
2. Ideate
With the needs statement as our north star, we next held a Big ideas brainstorming exercise. Together we came away with 60+ ideas.
-
3. Prioritize
We identified the ideas that would be the biggest wins using a value vs. feasibility matrix.
-
4. Hills statements
Together with product management and using the information from our sessions, we identified 3 hills to help guide our design process.

Users need a way to have visibility into all fulfillment components to have confidence that the system is configured correctly and will lead to expected outcomes.


Hills
The fulfillment manager can visualize Optimizer network performance, business outcomes, and value without needing help from IBM.
The fulfillment manager can monitor KPIs across multiple customized workspaces allowing him to be self-sufficient in finding and analyzing information.
The fulfillment manager can use optimization insights to take action according to their business strategy.
Outcome + Focus areas
The outcome of this workshop was clarity in what to focus on to best help our users. In addition to improvements to our existing Results Explainer functionality, creating a dashboard was a clear solution.
Design process
With our hills in place, we were ready to begin internal analysis and wireframing.
We started by evaluating existing monitoring solutions across our offerings.
We then completed an As-is / To-be scenario map of our persona’s journey.
We met with engineering to understand which KPIs were readily available, which were feasible in the short term, and which were out of scope. We also met with sponsor users to find out which are the most important to them.
With a confirmed list of available KPIs, we began visualizing the data for each metric. Our Carbon Design System has robust charting guidance, so we were able to pull from those components for the majority of our KPIs.
We designed drill-in views for some of our more complicated KPIs, so users were able to dig deeper into their data.
Through frequent cross-functional meetings to review designs, get feedback, and iterate further, we came to an agreement on a robust dashboard design for our customers.
With our final file delivery, we included specs for accessibility compliance such as tab order using our Equal Access Toolkit.
Evaluative feedback
We met with customers to share our new designs and gather their feedback. The feedback was very positive, with a few constructive requests for us to work into our future sprint plans.
Filtering capabilities: Customers want to filter by region, node type, and date range.
They want to see unit capacity as well as percentage, how many are over, how far over, etc.
They want to be able to export the data.
“When is this going to be released?”
“Anything that gives us a view towards trends would be valuable and something we don’t have today.”
“We constantly feel like we’re in a state of reaction. It’s amazing to think we could be in a position of being more proactive.”
Outcome
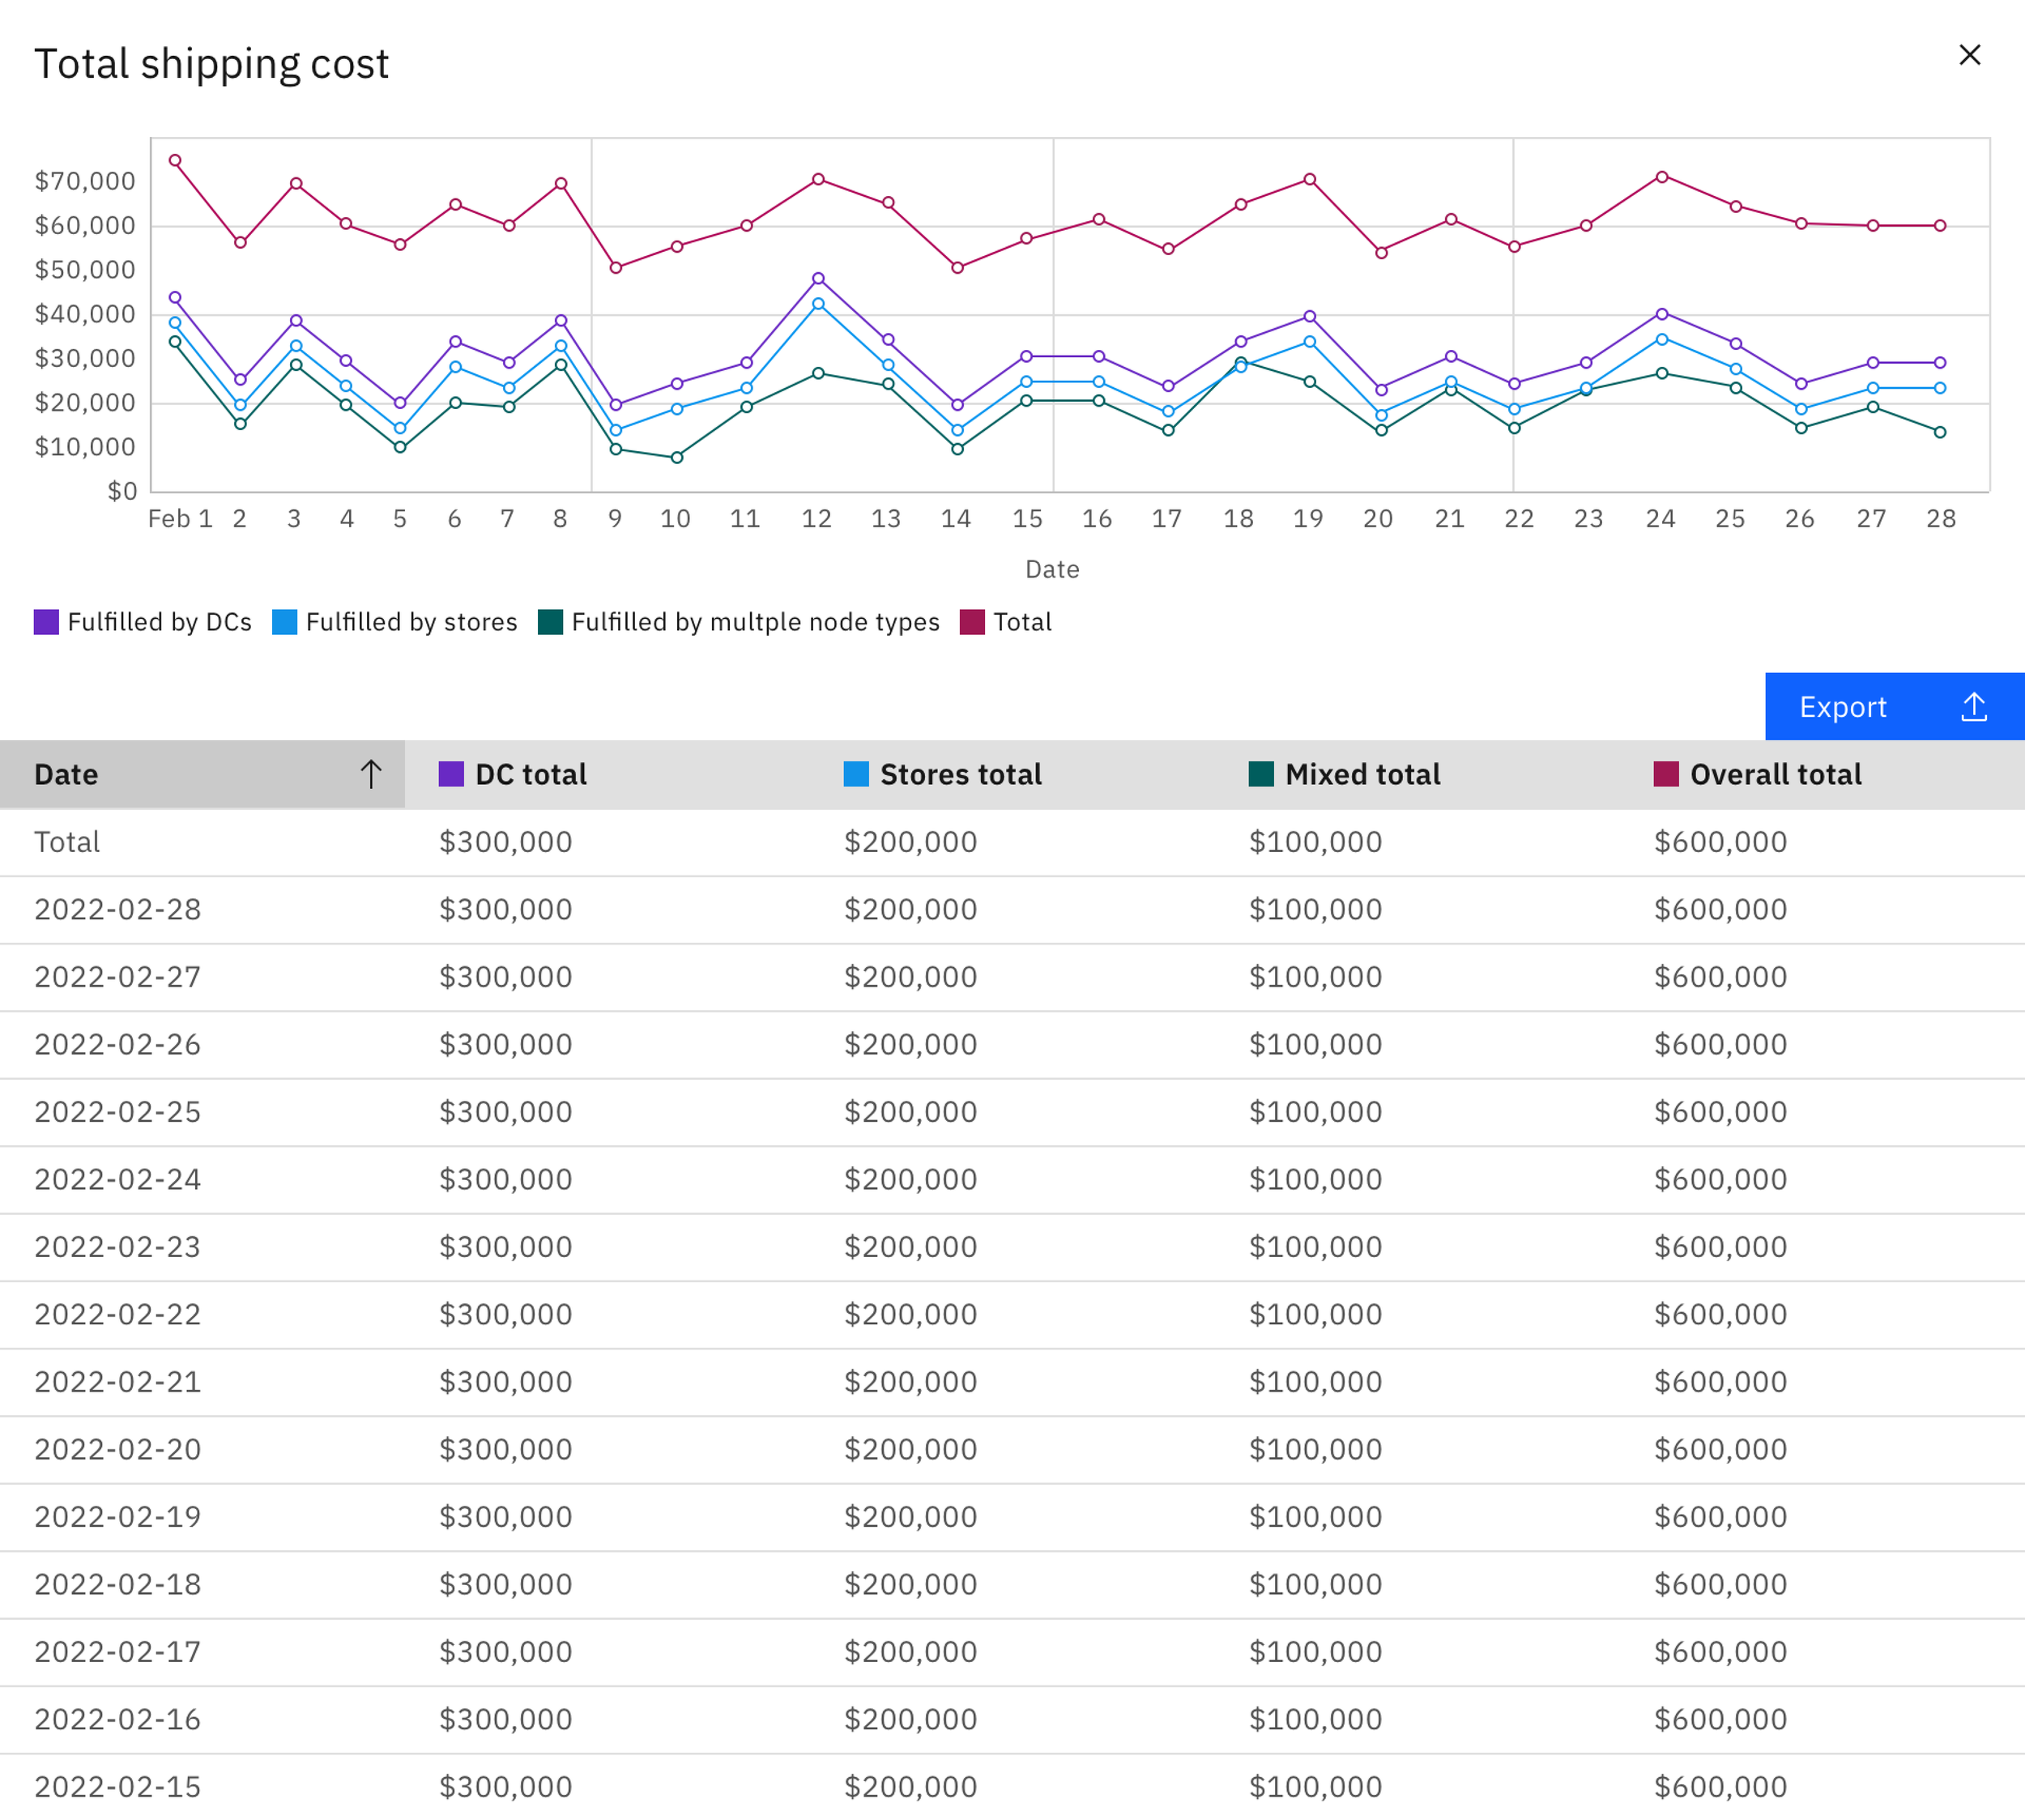
The Optimization dashboard allows users to view information about their nodes and KPIs related to costs, orders, packages, and units to quickly identify anomalies and be proactive instead of reactive.
🤝 Successfully increased customer trust in AI
🖋️ Customers upgraded their services due to the optimization features in Sterling Fulfillment Optimizer
🏆 Design team received Outstanding Innovation & Technical Achievement Award
“Part of the reason why we upgraded to Order Management on Cloud was the value that we can get out of Sterling Intelligent Promising.”
Personal takeaways
+
Gained deeper knowledge of designing for AI
+
Formed closer relationships with cross-functional team members
+
True end-to-end UX work from discovery to delivery
All UIs © International Business Machines Corp. This material is not for redistribution or modification without consent from IBM.